Fleet-Wide Python Performance Visibility
Fleet-wide Python observability for teams running Epochly in production. Real-time service health, performance analytics, and optimization tracking — without SSHing into each box.
Use Lens to see where Python performance work matters, then compare candidate workloads against benchmark examples.
What you get with Lens
Everything you need to understand what Epochly is doing across your fleet — from high-level health to per-function detail.
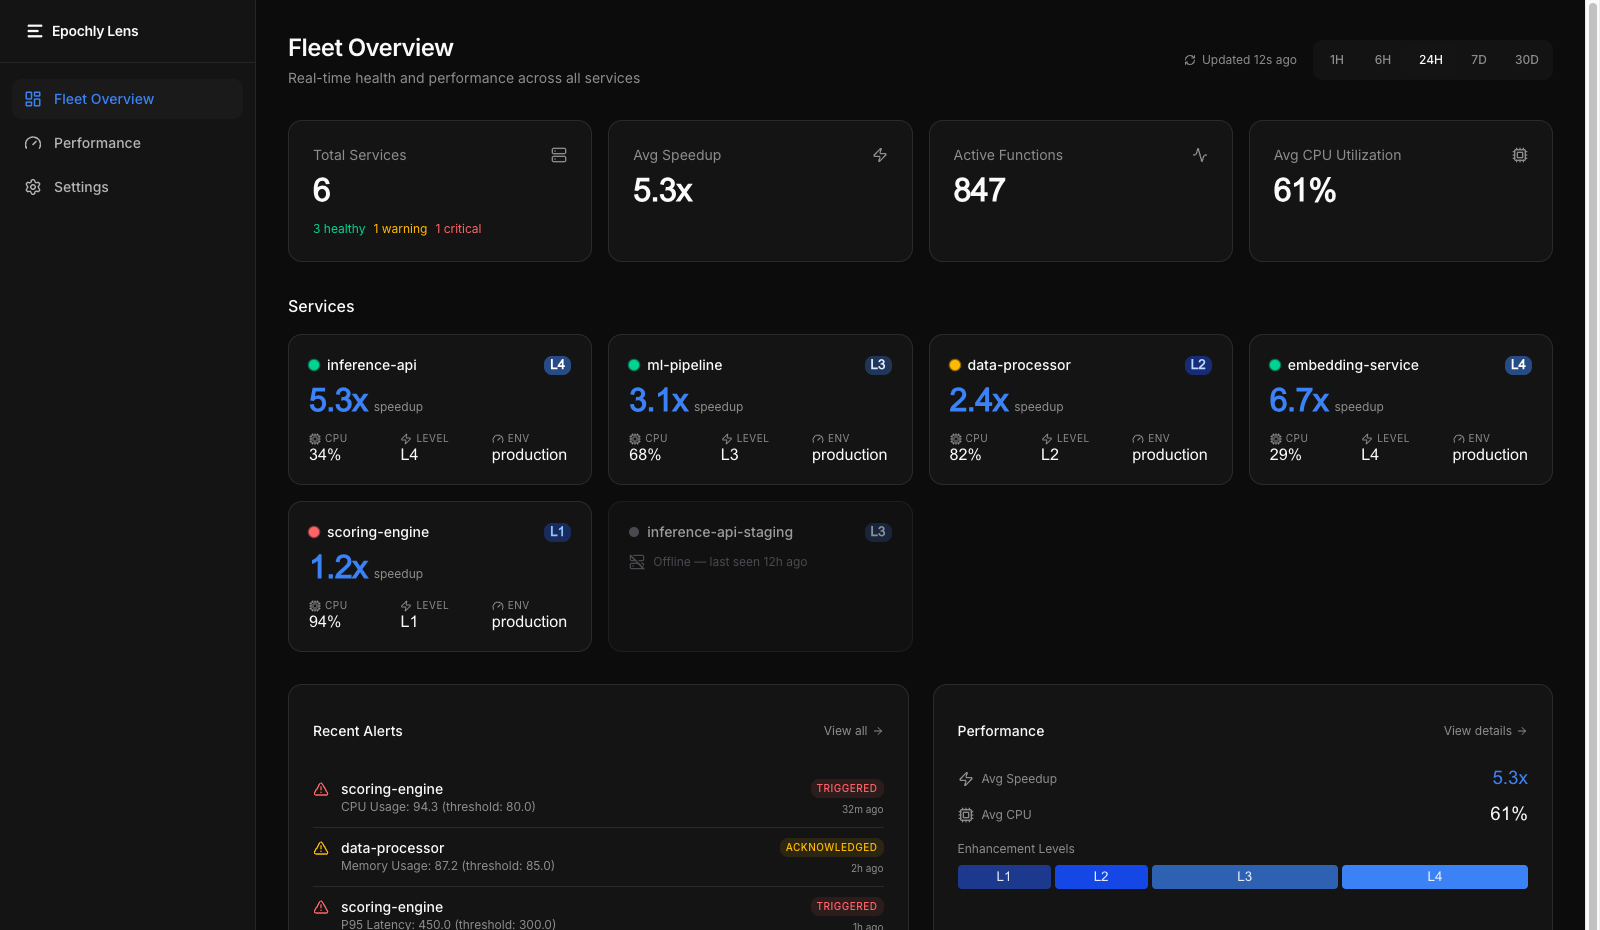
Fleet Health Grid
Service status at a glance
Real-time status dots for every service — healthy, warning, critical, offline. See optimization coverage and enhancement levels (L0-L4) across your fleet.
Performance Analytics
Latency, throughput, JIT stats
Latency distributions, throughput trends, JIT compilation statistics, and cache hit rates. Understand exactly where Epochly is helping.
CPU Hotspot Detection
Find bottlenecks across services
Identify the top CPU consumers across your fleet, sorted by usage. See which functions are eating cycles and where JIT compilation could help.
Service Drill-down
Per-service detail
Deep-dive into individual services. JIT compilation stats, current enhancement level, and key performance metrics.
Alert System
Configurable thresholds
Set performance thresholds and get notified when services degrade. Pro: 3 alert rules. Enterprise: unlimited.
Enhancement Tracking
L0-L4 progressive optimization
Track each service's progression through Epochly's enhancement levels. See which services are monitoring-only (L0) vs fully GPU-accelerated (L4).
Built for your team
Whether you're debugging a single service or managing a fleet, Lens gives you the visibility you need.
Performance Engineer
“Running Epochly on 8 services. Need to know which functions are JIT-compiled and where the bottlenecks are — without reading logs.”
Open DashboardML Platform Lead
“Managing inference across 3 regions. Need fleet-wide visibility into optimization coverage and performance impact.”
Open DashboardEngineering Manager
“Evaluating Epochly for the team. Need proof that it's actually helping before expanding rollout.”
Open DashboardLens by tier
Every tier includes Lens access. Higher tiers unlock more data, longer retention, and fleet-wide visibility.
Dashboard access is the interaction mode. Visible time window is what you can select inside the dashboard. Data retention is how long telemetry is stored on the backend. Community data is retained for 7 days but only the current 24h is directly viewable.
| Feature | Community | Pro | Enterprise |
|---|---|---|---|
| Dashboard access | Read-only snapshot | Full interactive | Fleet-wide |
| Visible time window | Current 24h only | 24h, 7d, 30d | 24h, 7d, 30d, custom |
| Data retention | 7 days | 30 days | 395 days |
| Alerts | — | 3 rules | Unlimited |
| Team management | — | — | RBAC + audit log |
| Fleet view | — | Single service | All services |
Start monitoring your fleet
Lens is included with every Epochly installation. Sign up, connect your services, and see your fleet in under 60 seconds.